Dear friends. I’m searching for detailed information about the server diagnostic tool. I am trying to understand the idea behind the scopes. I mean, how to be sure that my server is working good or
not. Thank you.
you can send once in while the command
INFO 1
You get status info about channel one…
Thank you @Theo, but i asking for the monitoring tool diagnostic. You suggest to check the channel status when the server is working, and i need to know how to understand the information that the tool offers about the hardware, software, consumers, producers, etc.
I can’t find info about that.
How do you use CasparCG, do you use/program your own client?
Or do you only use the Caspar Client to control playout.
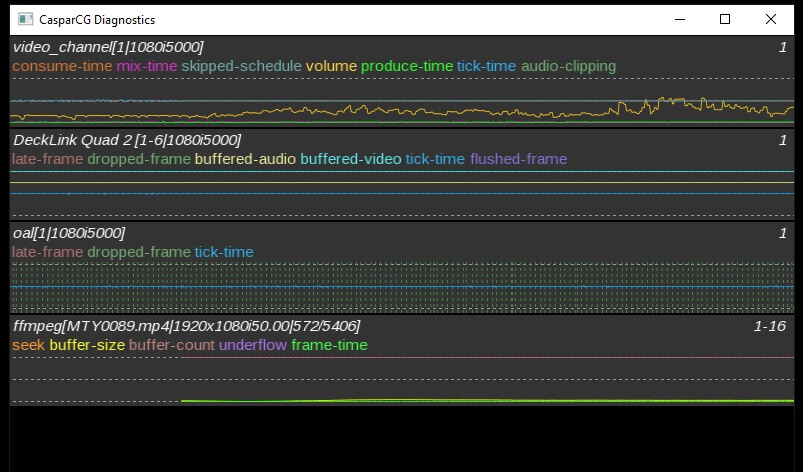
The DIAG screen you send is coming from osc info I think…
The DIAG screen is directly generated by the server computer. Type the command DIAG in the server console screen to start the display.
It has been suggested that a future release of the server should implement the DIAG facility using OSC or similar, thereby enabling the diagnostic information to be seen at an operational position or checked by a remote site.
Hi @macbab,
I was recently running into stuttering issues and was also looking for a detailed explanation on the DIAG screen. The information is a bit scattered on the CasparCG github help repository wiki, but about 70% of the information is there.
The first page you should read is regarding the DIAG screen itself: Server: Diagnostics · CasparCG/help Wiki · GitHub
This page does not cover all the producers or consumers (only the video channel and FFMPEG diag parts), but gives a good rundown on how to read the scopes and how to interpret what is good or bad.
Also, some producers or consumers go into more detail on their diagnostics outputs and also specify their scale, like the FFMPEG producer: FFmpeg Producer · CasparCG/help Wiki · GitHub, but not all producers or consumers have such a dedicated chapter.
What I also did was search the Github repository for the names shown in the diag screen, which sometimes returned good results, but it also seems a few parts of the DIAG screen are currently undocumented.
Also, the forum seems to also be a good basis for when you are looking at a certain value, I used the forum search a few times when the Github repository did not have the answer.
Hope this gives you a good starting point!
P.S. The volume line the the video channel can be misleading, it jumps above the middle dotted line often (which is normally bad, the middle dotted line represents real-time), but because it is displaying volume and not something that needs to run realtime , this can be safely ignored. I was chasing my tale for a good hour before I noticed it was the volume graph.
Thank you very much Standekker. Your guide is very useful.